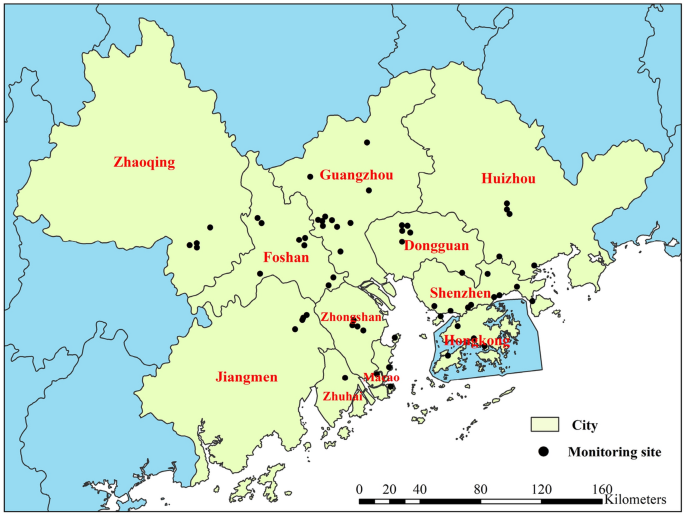
Spatiotemporal distribution and monthly variation of PM2.5 and MDA8 O3
Figure 2 indicates the spatial pattern and average concentrations of PM2.5 and MDA8 O3 across various cities in the GBA over the five-year period. Overall, there was a gradual decrease in PM2.5 concentration in each city from 2015 to 2019. Additionally, the spatial distribution of PM2.5 remained consistent each year, exhibiting a pattern of decrease from northwest to southeast, which was consistent with previous findings by Lin et al.26 and Miao et al.27 utilizing satellite remote sensing technology. The highest PM2.5 concentration was recorded in Zhaoqing (31.8–40.4 μg m−3), followed by Foshan (29.8–39.6 μg m−3) and Dongguan (31.9–37.1 μg m−3). This phenomenon could be attributed to the fact that these cities are inland and the presence of mountains obstructs the dispersion of PM2.59. The concentrations in square brackets represent the maximum and minimum values of PM2.5 during 2015–2019. However, coastal cities benefit from ocean breezes, which facilitate the dispersion and dilution of PM2.5. Furthermore, higher levels of precipitation aids in the deposition of PM2.5, thereby reducing its concentration in the air. Therefore, the concentration of PM2.5 in coastal cities such as Hong Kong (18.9–27.0 μg m−3), Macao (17.4–29.3 μg m−3), Shenzhen (24.1–29.8 μg m−3), and Huizhou (24.8–29.5 μg m−3) was relatively low. A similar phenomenon was also observed in the study by Fang et al.18.
Figure 2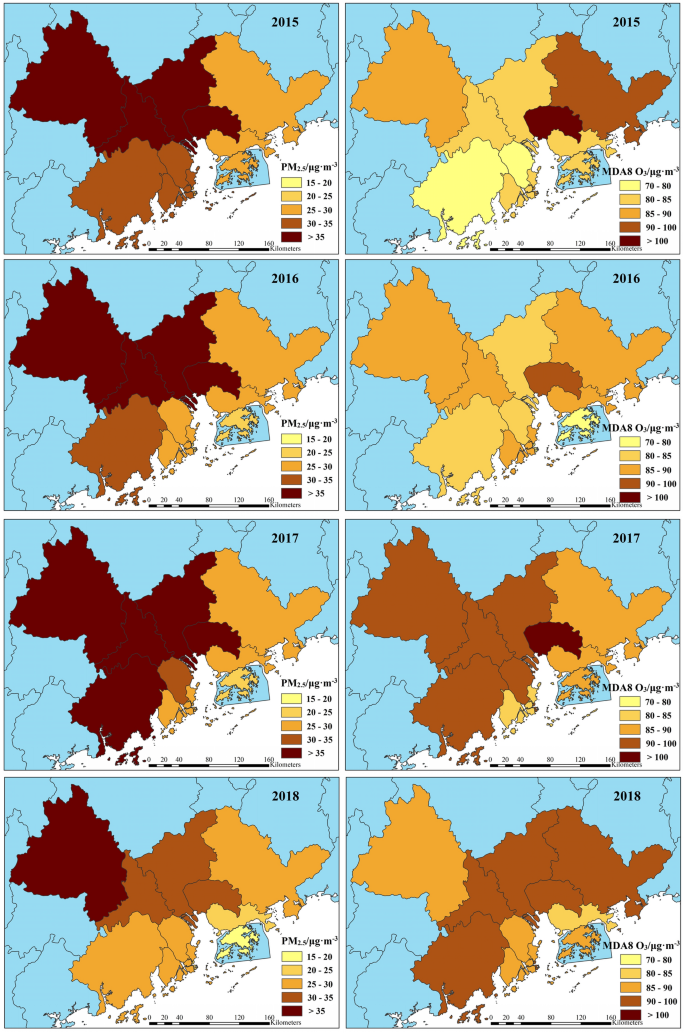
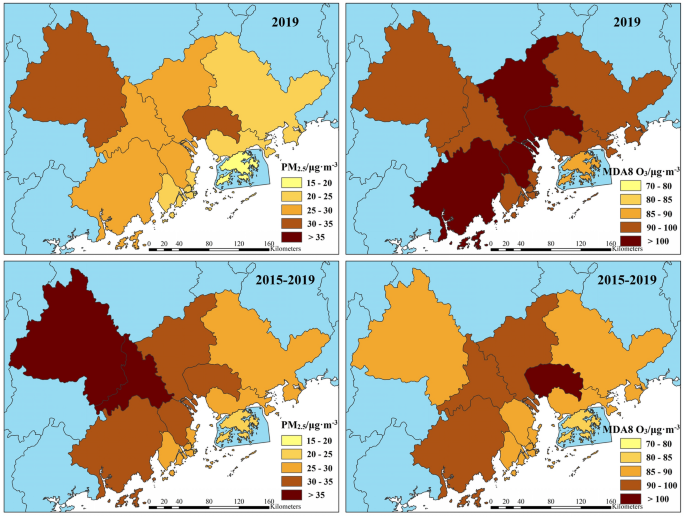
Spatio-temporal distribution of PM2.5 and MDA8 O3 in each city from 2015 to 2019 (The map was generated by ArcGIS 10.7 https://www.esri.com/en-us/arcgis/products/arcgis-desktop/resources).
MDA8 O3 presented the opposite spatiotemporal distribution compared to PM2.5, with its concentration generally increasing in each city during the period between 2015 and 2019. Spatially, MDA8 O3 concentration exhibited a decreasing pattern from east to west. Higher concentrations were observed in Dongguan (92.3–110.7 μg m−3), foshan (81.5–99.8 μg m−3), and Jiangmen (73.2–104.2 μg m−3), whereas some cities like Hong Kong (77.5–88.8 μg m−3) and Shenzhen (80.3–93.8 μg m−3) had lower concentrations. This disparity may be attributed to higher temperatures, stronger photochemical reactions, and larger emissions of O3 precursors such as NOx and VOCs from ships and ports in coastal cities10.
To investigate the seasonal variations of PM2.5 and O3, Fig. 3 illustrates their monthly average concentrations over the five-year period. While PM2.5 exhibits minor fluctuations across different months and years, its monthly pattern generally resembles a “V” shape, with higher concentrations in winter (Dec., Jan. and Feb.) and autumn (Sep., Oct. and Nov.), and lower concentrations in summer (Jun., Jul. and Aug.) and spring (Mar., Apr. and May.). The highest concentration of PM2.5 occurs during winter, which was attributed to increased anthropogenic emissions and unfavorable meteorological conditions17. Lower temperatures, reduced light intensity, shorter sunshine duration, and stable atmospheric stratification in winter facilitate the formation of a strong and persistent inversion layer. This inhibits the diffusion and dilution of PM2.5, leading to its continuous accumulation in the air and frequent heavy pollution events9. PM2.5 levels begin to decline from January, reaching their lowest point in June, and gradually increase thereafter until December. During summer, PM2.5 concentrations remain low due to factors such as intense solar radiation, strong atmospheric convection, and a thinner temperature inversion layer, which collectively enhance air ventilation and PM2.5 dilution. Additionally, summer weather is typically rainy, and the wet deposition of particulate matter, along with cleaner air brought by marine monsoon, contributes to the removal of PM2.511.
Figure 3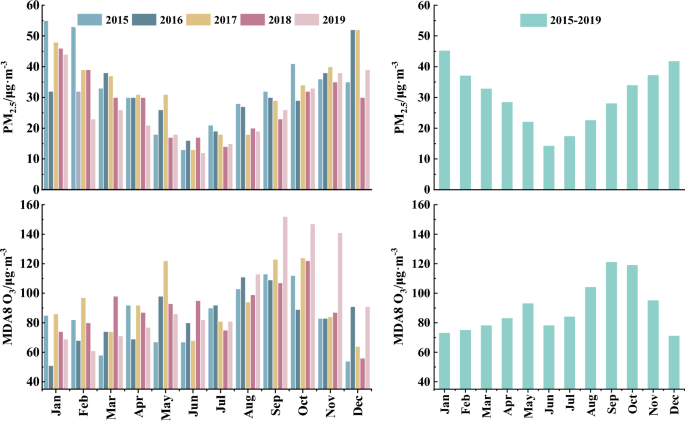
Monthly variation characteristics of PM2.5 and MDA8 O3 in the GBA.
Studies have suggested that the concentration of O3 in southern cities was significantly higher than that in northern cities in China9. In northern cities, the monthly variation of MDA8 O3 formed an inverted V shape, with the highest concentration occurring around June8. Conversely, in southern cities, it exhibited a distinctive M-shaped pattern, peaking in May–June and then gradually decreasing, with a second peak in September-October8,9, which is consistent with the findings of this study. Regarding seasons, higher MDA8 O3 levels were observed in autumn, followed by summer, spring, and winter. Surface O3 is primarily produced through the photochemical reaction of precursors, a process whose rate is influenced by various meteorological conditions, including temperature, solar radiation, relative humidity, and precipitation10. Typically, during summer, characterized by high temperatures, ample sunshine, and dry air, the photochemical reaction of O3 precursors intensifies, facilitating the formation of O3. However, our study reveals a noteworthy finding: the peak MDA8 O3 concentration occurred in September during autumn, rather than in summer. This was attributed to the frequent precipitation in summer, which effectively inhibited the production of O32. The lowest MDA8 O3 concentrations were observed in winter. Firstly, colder temperatures and weaker sunlight reduce the occurrence of photochemical reactions that generate O3. Additionally, atmospheric stability in winter hinders the mixing and dispersion of O3. Moreover, emissions of O3 precursors like VOCs from plants may decrease in winter, further limiting O3 formation. Overall, these factors contribute to lower O3 concentrations during the winter months10.
Change trends of PM2.5 and MDA8 O3 during 2015–2019
Figure 4 illustrates the trend analysis of the two pollutants in the GBA and its corresponding cities. The annual average PM2.5 concentrations in this area from 2015 to 2019 were 33.1 μg m−3, 30.6 μg m−3, 32.4 μg m−3, 27.7 μg m−3, and 26.1 μg m−3, respectively, indicating an overall downward trend. Linear fitting based on the average concentration of each year over the five-year period revealed a decline rate for PM2.5 in this region of 1.7 μg m−3/year. Among the eleven cities analyzed, Macao (-2.8 μg m−3/year), Foshan (-2.5 μg m−3/year), Guangzhou (-2.1 μg m−3/year), Jiangmen (-2.0 μg m−3/year), and Hong Kong (-1.9 μg m−3/year) exhibited higher decline rates over the five-year period. Conversely, Huizhou (-0.6 μg m−3/year) and Dongguan (-1.0 μg m−3/year) experienced lower declines. By 2019, although the annual average PM2.5 concentration of all cities in the GBA fell below the level-2 Chinese Ambient Air Quality Standard (CAAQS, GB3095-2012) threshold of 35 μg m−3, none of the cities had yet achieved the Grade I annual standards (15 μg m−3) specified in the CAAQS. Thus, PM2.5 pollution remains a significant concern in this region, necessitating the implementation of more stringent air pollution control measures to enhance air quality.
Figure 4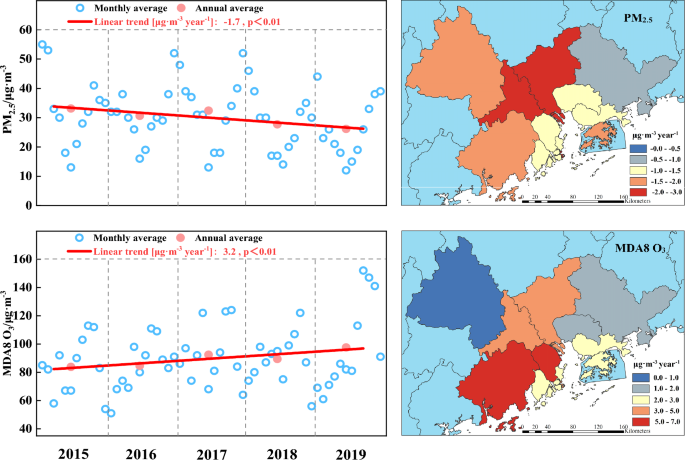
Linear change trend of PM2.5 and MDA8 O3 in five years (The map on the right was generated by ArcGIS 10.7 https://www.esri.com/en-us/arcgis/products/arcgis-desktop/resources).
Contrary to PM2.5, MDA8 O3 in the GBA has generally exhibited an upward trend over the past five years, with concentration of 83.8 μg m−3 in 2015, 84.6 μg m−3 in 2016, 92.4 μg m−3 in 2017, 89.4 μg m−3 in 2018, and 97.6 μg m−3 in 2019. The average rise of MDA8 O3 over the period 2015–2019 was 3.2 μg m−3/year. Notably, the upward trend was particularly evident in eight cities, except for Zhaoqing (+ 1.0 μg m−3/year), Huizhou (+ 1.3 μg m−3/year), and Dongguan (+ 1.8 μg m−3/year). Specifically, significant increases were observed in Jiangmen (+ 6.9 μg m−3/year), Zhongshan (+ 5.8 μg m−3/year), Guangzhou (+ 4.5 μg m−3/year), and Foshan (+ 4.0 μg m−3/year). Consistent with our findings, previous studies have also indicated a shift in China’s main air pollutant from PM2.5 to O3 since 201319,28. Indeed, there exists a correlation between the overall decline in PM2.5 and the rise in O3. Li et al.19 demonstrated that a key factor contributing to the increase in summer O3 in the North China Plain during 2013–2017 was the decrease in PM2.5, which enhanced surface solar radiation and facilitated atmospheric photochemical reactions, thereby exacerbating O3 pollution. However, these relationships are not purely causal, as the increase in O3 is complex and influenced by various factors such as meteorological conditions, emission sources, and chemical reactions17. Consequently, while future efforts should prioritize controlling PM2.5, the government should also closely control O3 pollution in this region.
Numerous studies have documented changes in PM2.5 and O3 pollution across various regions of China in recent years. In Beijing, for the period 2014–2018, PM2.5 levels were observed to decrease while MDA8 O3 levels were on the rise, with rates of change measured at 7.4 μg m−3/year and 1.3 μg m−3/year, respectively29. Similarly, in the YRD region during the same period, Zhao et al.17 reported a decline in PM2.5 and an increase in MDA8 O3 by 3.1 μg m−3/year and 3.6 μg m−3/year, respectively. In the BTH region, the rates of change were even more pronounced at 7.1 μg m−3/year for PM2.5 decrease and 5.4 μg m−3/year for MDA8 O3 increase. Contrastingly, in the PRD region, PM2.5 exhibited a decreasing trend of 2.2 μg m−3/year from 2015 to 2020, while MDA8 O3 increased by 1.8 μg m−3/year30. While the decline rate of PM2.5 in the other 9 cities except Macao and Foshan was much lower than that observed in Beijing, YRD, and BTH regions, and the rising rate of MDA8 O3 was comparatively lower than in the YRD and BTH regions, it is noteworthy that MDA8 O3 levels in the GBA still reached nearly 100 μg m−3 in 2019, significantly exceeding the national average level. These findings underscore the imperative for further improvements in PM2.5 and O3 levels in the GBA.
Health impact assessment of PM2.5 and O3
Since the establishment of air quality monitoring stations in 2013, previous studies have extensively assessed the health impacts of air pollution across China15,16,17,22,23,24. A study conducted by Kuerban et al.23 found the numbers of premature deaths, cardiovascular diseases, respiratory diseases, and chronic bronchitis attributed to long-time PM2.5 exposure in China for the year 2018 were 334,118, 70,983, 109,327, and 228,855, respectively. They decreased by 23%, 25%, 27%, and 27%, respectively, compared to 2015, reflecting China’s achievements in controlling health risks from PM2.5 in recent years. Regarding long-term exposure to O3 in 2019, predictions indicated that health impacts estimates on all-cause mortality, respiratory mortality, and cardiovascular mortality were 181,000 (95% CI 91,500–352,000), 33,800 (95% CI 0–71,400), and 112,000 (95% CI 38,100–214,000), respectively, which increased by 53%, 55%, and 53%, respectively, compared to the year 201522. While these studies have significantly contributed to our understanding of PM2.5 and O3 health risk assessment in China, it’s essential to acknowledge that they uniformly applied the same mortality rate (Fp) for health endpoints across all cities in China, potentially reducing the reliability of the evaluation results. Given the differences in Fp values for health endpoints across different cities, the utilization of municipal-level Fp values for health endpoints in this study could yield a more accurate health risk estimate compared to previous studies.
Table 2 shows that the total PM2.5-related all-cause mortality, cardiovascular diseases, and respiratory diseases in the GBA in 2019 were 21,113 (95% CI 4968–31,048), 1333 (95% CI 762–1714), and 1424 (95% CI 0–2848), respectively, indicating decreases of 27.6%, 28.0%, and 28.4%, respectively, compared to 2015. At the municipal level, the highest percentage decrease in PM2.5-attributed all-cause mortality from 2015 to 2019 was observed in Macao (60.9%), followed by Hong Kong (46.6%) and Foshan (31.2%), suggesting that the control of PM2.5 has brought better health benefits for them.. Health effects associated with PM2.5 mainly depend on PM2.5 concentrations and population size. As a result, certain cities with high levels of PM2.5 and population density, such as Foshan [all-cause deaths (AD): 2963–4367; cardiovascular deaths (CD): 179–267; respiratory deaths (RD): 190–282], and Dongguan [AD: 3385–4147; CD: 217–268; RD: 198–244], have exhibited a significant number of deaths (see Fig. 5). Note that the range in brackets indicates the number of deaths from 2015 to 2019. Although Zhaoqing [AD: 1921–2648; CD: 101–141; RD: 173–240] had the highest concentration of PM2.5 among all cities, its population is relatively small compared to others, resulting in a lower number of deaths caused by PM2.5. Similarly, while Guangzhou’s [AD: 5523–7901; CD: 373–540; RD: 432–624] PM2.5 concentration is not exceptionally high, its population exceeds 16 million, making it the city with the greatest health risk from PM2.5 exposure. Furthermore, despite Shenzhen’s [AD: 869–1208; CD: 69–96; RD: 69–96] larger population, its PM2.5 pollution levels are relatively lower, resulting in reduced health risks related to PM2.5 exposure.
Table 2 Estimation of the impact of PM2.5 and O3 on human health in the GBA.Figure 5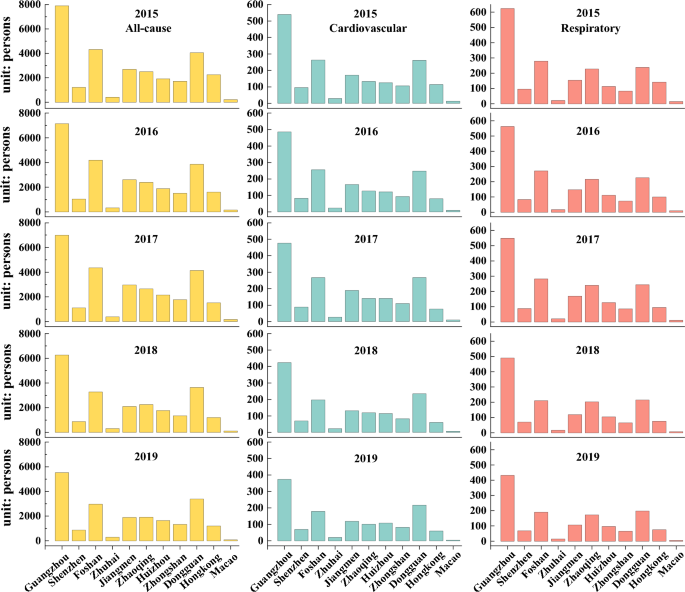
The estimated PM2.5-related health impacts in various cities during 2015–2019.
On the contrary, the all-cause, cardiovascular and respiratory-related deaths due to long-time O3 exposure increased by 45.9% from 11,161 (95% CI 5581–22,323) to 16,286 (95% CI 8143–32,572), 46.2% from 5009 (95% CI 1670–9685) to 7321 (95% CI 2440–14,155), and 44.2% from 4379 (95% CI 0–9414) to 6314 (95% CI 0–13,576), respectively, during 2015–2019 (Table 2). Spatially, a significant percentage increase (> 30%) in all-cause deaths were observed in Guangzhou (61.3%), Jiangmen (41.6%), and Foshan (33.0%), highlighting the urgent need for implementing O3 control measures in these cities. However, the increases in the mortality burden of diseases attributable to O3 were not significant in Macao (1.0%) and Zhuhai (3.1%). Similar to PM2.5, Guangzhou [AD: 2423–3941; CD: 1170–1894; RD: 1114–1796], Dongguan [AD: 1799–2628; CD: 821–1194; RD: 616–891], Foshan [AD: 1266–2074; CD: 546–890; RD: 477–774], etc. had a higher number of O3-related deaths due to their large population, as shown in Fig. 6. Although Shenzhen had a larger population, its O3 concentration was lower, so it had only 495–738 AD, 282–419 CD, and 233–345 RD, because its Fp values and O3 concentration were very low. In addition, Jiangmen [AD: 665–1682; CD: 301–756; RD: 223–555] had relatively high O3 levels despite its small population, resulting in a comparatively high O3 risk. Conversely, Hong Kong[AD: 956–1394; CD: 347–504; RD: 355–515], with a larger population but the lowest O3 concentration among all cities, also experienced higher risks associated with O3.
Figure 6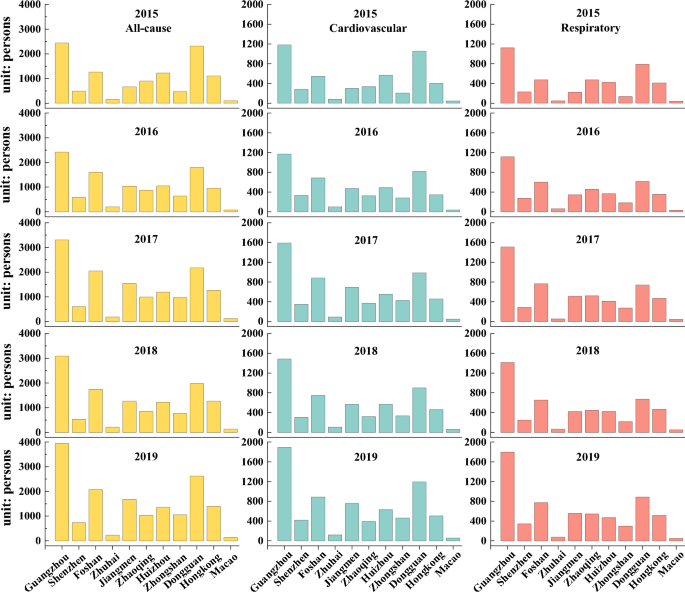
The estimated O3-related health impacts in various cities during 2015–2019.
Exposure–response coefficient (β) and safety threshold (C0) are critical factors in air pollution risk assessment. In China, due to the absence of comprehensive cohort studies on long-term exposure to PM2.5 and O3, there is no uniform determination of β values20. Consequently, different epidemiological studies have employed varying β values, leading to differing estimations of health risks31,32,33. For example, Feng et al.34 and Zhang et al.12 used different β values to estimate total mortality attributed to PM2.5 in China for 2015, reporting 1,130,000 and 1,850,000 deaths, respectively. Additionally, Zhang et al.24 utilized β values from Zhang et al.21 and Yin et al.14 to calculate 205,800 (95% CI 176,200–240,000) and 121,500 (95% CI 66,200–176,221) AD caused by O3 exposure across China in 2015, respectively. Currently, there is no theoretical explanation for C0. Regarding C0 for PM2.5, the World Health Organization (WHO) has recommended a reference concentration of 10 μg m−314,35. Regarding the O3 threshold value for short-term exposure, currently, there is no theoretical explanation. The WHO has recommended 35 ppb (70 μg m−3) as the baseline level of O322, while a threshold of 100 μg m−3 has been deemed safe for public health by both the CAAQS Grade I and WHO23. In previous studies on the health risks of long-term O3 exposure, epidemiological studies have confirmed that a threshold value of 26.7 ppb has the highest correlation with disease mortality22. Therefore, this study utilized it to evaluate the health risks of long-term O3 exposure. When employing the same β and C0 values as used in our study, Kuerban et al.23 estimated that the total AD attributed to PM2.5 in the 9 cities of the PRD were 20,306 and 18,877 in 2015 and 2018, respectively, which were lower than our evaluation results. However, their estimates for both CD and RD were notably higher than ours. A similar discrepancy was observed when comparing the estimation of human health risks caused by O3 in our study with the results of Zhao et al.16. One potential explanation for this disparity between these studies is that our study utilized city-level FP values, whereas their studies employed the national average FP value for each city16.
It is imperative to acknowledge that this study entails certain uncertainties. On the one hand, the acquisition of mortality data for various cities presents challenges, leading us to rely on the average Fp values reported by Liao et al.25 for the years 2006–2012 to assess the health impacts of PM2.5 and O3 in GBA from 2015 to 2019. Despite the minimal annual fluctuations in Fp values per city, they could still impact the estimation results of this study. On the other hand, the current distribution of air quality monitoring stations predominantly focuses on urban areas within the GBA and is limited in number. In this study, the annual average concentrations of PM2.5 and O3 for each city were determined by averaging the data from all monitoring stations within that city, which could also affect the accuracy of the assessment results to some extent. While spatial interpolation techniques offer insights into the spatial distribution of pollutant concentrations, their efficacy is constrained by the scarcity of monitoring stations. Additionally, the absence of crucial data such as the number of disease-related deaths across different hospitals and the spatial distribution of cases significantly impacts the estimation of health mortality. In summary, to more accurately assess the impact of atmospheric pollution on human health, it is necessary for future research to establish more air quality monitoring stations in the region. Additionally, the utilization of more precise disease data can help mitigate this uncertainty.


